scope filter visual design without the noise
Two black and white images are placed over a blue wave background. The top image is a detailed illustration of a betta fish in profile with the label Betta Fish. The image below it is of a snorkeling tube and diving mask with the label Fishing Alternatives, Snorkelling.

ESR Book Illustrations

Written by Valerie Monckton and Wasseem Emam of Ethical Seafood Research and illustrated by Travis Jeans, Understanding Our Underwater Cousins explores the hidden world of aquatic animal welfare, guiding readers through the blue with engaging illustrations and thought-provoking activities.

Detail

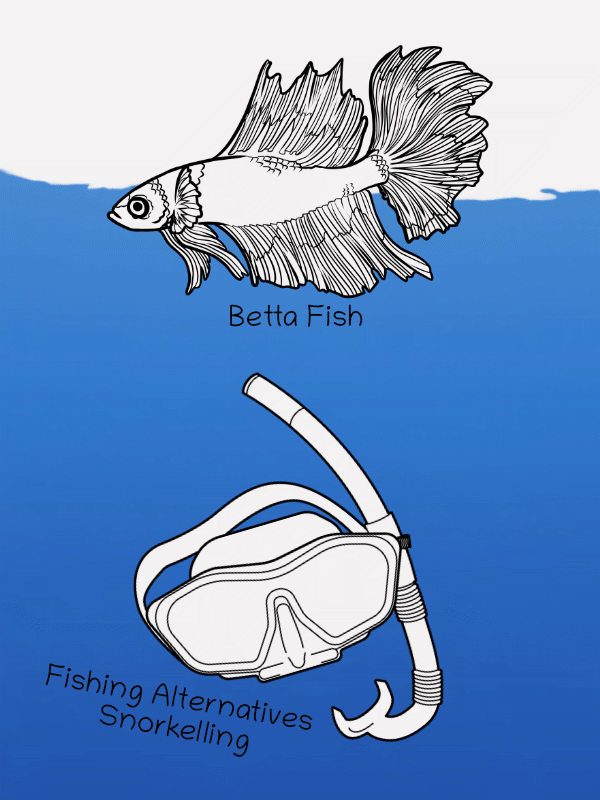
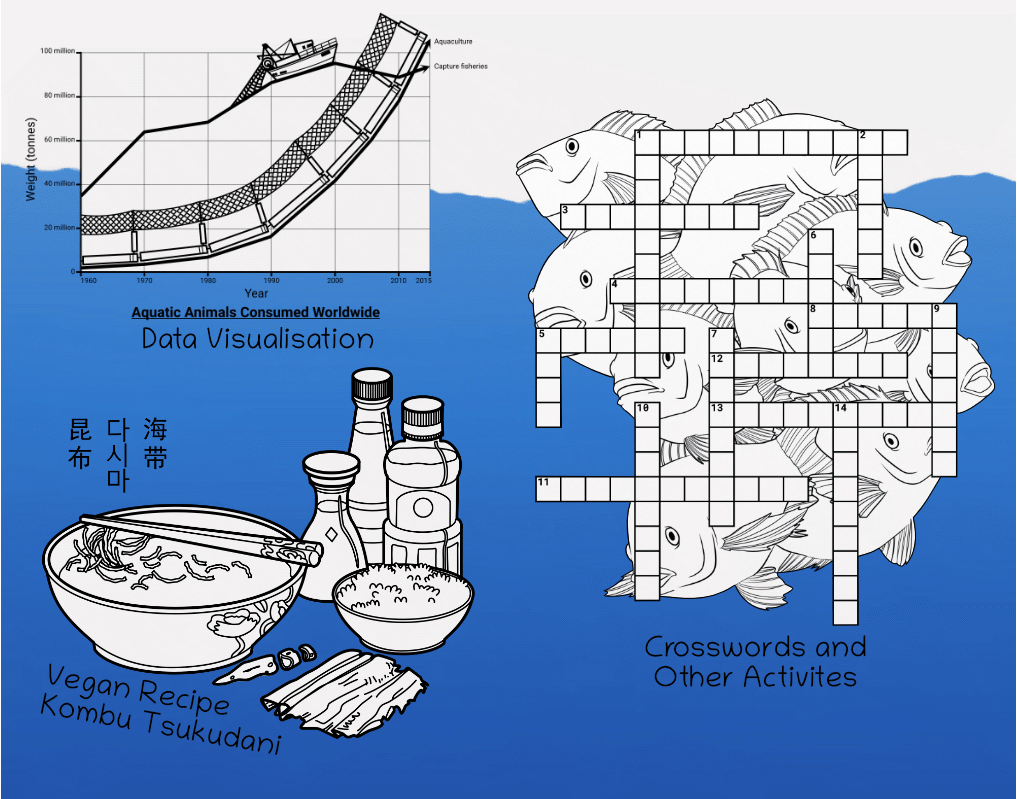
I illustrated over 40 black and white images for the book as part of activities (e.g. crosswords, labelling, recipes) or decoration.

I researched and collected reference images to make sure what was depicted was based on real life situations. For a book presenting research on animal welfare, ensuring the drawings were as true to the available evidence as possible helped support the educational goals of the book.

I worked with one of the book's authors, Valerie Monckton, to get feedback on drafts and to make improvements after beta testing (e.g. task difficulty).

Tools used include Clip Studio Paint, Affinity Designer, and Affinity Publisher.

For more, see ESR Book Cover.

There are three black and white illustrations over a blue background. On the top left is an illustration of a graph with the title Aquatic Animals Consumed Worldwide, on the Y axis is Weight in tonnes with ticks for 0, 20 million, up to 100 million. On the x axis is Year from 1960 to 2015. The graph has two lines, the aquaculture line starts around 0 around 1960 but exponentially increases to over 100 million tonnes by 2015. The second line, capture fisheries, starts around 35 million around 1960 and gradually rises and levels off at about 90 million tonnes by 2015. The aquaculture line is embellished with a fishing cage net. The capture fisheries is embellished by a fishing trawler with a net trailing behind it. A large label captions the graph as Data Visualisation. Below it is an recipe illustration showing a soup bowl with chopsticks sitting over it and holding strands of kombu seaweed, with cooking ingredients beside it. There is a label for the food in japanese, korean, and simplified chinese. Beneath it is a large label Vegan Recipe Kombu Tsukudani. On the right is a crossword puzzle with an illustration of overcrowded tilapia swimming behind it with a large label Crosswords and Other Activities beneath it.

Return to Portfolio